
One car, two answers
Here is a measurement to start with. A Super Formula Lights 324, braking as hard as it can at Silverstone, slows at 1.10 g when it is traveling below 126 km/h. The same car, on the same lap, with the same brakes and the same four tires, slows at 2.29 g when it is traveling above 180 km/h.
Twice the stopping power, and nothing about the car changed between the slow corner and the fast one. No component was swapped. The brake discs did not grow. The rubber compound did not improve down the straight.
A number like that is a loose thread. Pull on it and the entire subject of tires and grip unravels into the open, because the explanation for that one measurement touches everything: what grip actually is, where it comes from, what strengthens it and weakens it, and why a race car is shaped the way it is. That is what this post is, an introduction to tires and grip from zero, with a running start provided by one strange, verifiable fact.
Everything here is built the same way. The subject gets taught in plain terms, and every number on the page is real: recorded telemetry from the Super Formula Lights 324 on iRacing, the case study car for this whole body of work. The session that produced each figure rides along by its id, so any number can be checked, re-derived, or challenged. This introduction leans on one session in particular: a sixteen lap run at race distance at Silverstone (Arena Grand Prix layout), session f78654b67c69e481, recorded at 60 samples per second. The lap most cited below, lap 12, is viewable interactively on Garage61, and its complete record, all 144 channels at 60 Hz, is downloadable from this site for anyone who wants to re-derive the numbers themselves.
Grip is a force, and the data can see it
Grip gets talked about like a texture, something sticky or slippery, a quality. For this entire series it is something much more useful: a force. Grip is the horizontal force that develops between a tire and the road, and it is the only thing that ever changes a car's direction or speed. Cornering is grip pointed sideways. Braking is grip pointed backwards. Acceleration is grip pointed forwards. There is no other mechanism; a car at speed is four small rubber areas negotiating with a road, and everything else on the vehicle exists to influence that negotiation.
Force is measurable, and that is what makes this subject teachable from data. A force on the car produces an acceleration of the car (Newton's second law does the conversion), and acceleration is a channel a simulator streams directly. The standard unit here is the g, one g being the acceleration of ordinary gravity. A road car on decent tires can hold roughly 1 g of cornering before it slides. Whatever a tire is doing, its output is written in g, sixty times a second, in the data.
The measurement convention for this series, stated once and kept forever: a claim is MEASURED when it comes straight from a recorded channel or a direct restatement of one (a peak, a percentile, a difference), and MODELED when an assumption or a fitted constant took part in producing it. The two never get blurred. And one honesty note that applies to every g in every post: a simulator's acceleration channels are the sim's own accounting of its own physics engine, gravity corrected, not an independent instrument bolted to a chassis. Within that boundary, they are treated as the measurement.
Here is the full set of numbers the opening puzzle came from, lap 12 of that Silverstone session, taken at the 95th percentile so a single spiked frame cannot masquerade as the truth (MEASURED):
| speed band | cornering g | braking g | traction g |
|---|---|---|---|
| under 126 km/h | 2.32 | 1.10 | 0.69 |
| 126 to 180 km/h | 2.61 | 2.00 | 0.57 |
| over 180 km/h | 2.65 | 2.29 | 0.31 |
Two things in this table deserve a long look before the explanation arrives.
First, the sheer size of the numbers. This car corners at 2.32 g even in its slowest corners, more than double what road rubber manages. Racing tires are a different technology, built from softer compounds that pay for their grip by wearing out in hours instead of years.
Second, and this is the heart of the whole subject: the numbers move. Grip is not a property a car has, like its mass. It changes band to band, corner to corner, moment to moment. The same four tires delivered 1.10 g of braking in one part of the lap and 2.29 g in another. Any model of grip as a fixed quantity is dead on arrival; whatever grip is, it is a variable, and the rest of this post is about what it varies with.
The first variable: load
Rubber grips by contact. Press it against a surface and it conforms to that surface, flowing into microscopic texture, gripping partly by interlocking with the roughness and partly by adhesion, a genuine molecular stickiness between compound and road. Both effects strengthen when the rubber is pressed down harder. Push a tire into the road with more vertical force and it gives back more horizontal force. Load is the throttle valve on grip.
That single sentence explains the opening puzzle, because there is one thing about a formula car that changes enormously with speed: the vertical load on its tires. The Super Formula Lights 324 carries wings, and wings press the car toward the road with a force that grows with the square of speed. At 100 km/h they add little. Approaching 250 km/h they are pressing the car into the track with a force worth multiples of the car's own weight. The tires at the end of the straight are the same tires from the hairpin, but they are being stood on far harder, so they can transmit far more horizontal force before letting go. Twice the braking at speed is not a property of the brakes. It is a property of the load on the rubber.
The claim, restated so it can be tested: grip rises and falls with vertical load, and a formula car's aerodynamics manipulate that load deliberately. The braking column of the table above is the evidence trail this car leaves, and the cornering column agrees, 2.32 g rising to 2.65 as speed and wing load come up. A caution belongs next to this, in the spirit this series is built on: the simulator does not stream a channel called downforce, so the split in any single corner between what the rubber earned mechanically and what the wings pressed into it is not directly measured in this session. The direction and the size of the pattern are measured; the clean separation of the two contributions takes a designed experiment, and that experiment belongs to a later post.
There is a second half to the load story, and it is quieter but it runs the entire craft of car setup. Grip rises with load, but not in proportion. Each additional newton of load buys slightly less additional grip than the one before it; the relationship bends. The consequence is that how load is distributed among the four tires matters as much as how much load exists in total. A car that leans hard onto one tire in a corner is trading efficiently loaded rubber for overloaded rubber, and the overloaded tire returns less per unit of load than what the unloaded side gave up. Springs, anti roll bars, ride heights, and the rest of the garage menu are, almost without exception, tools for managing that distribution. This introduction only plants the flag; the bending curve and its consequences get measured properly when the series reaches setup, because it is the single most consequential fact in it.
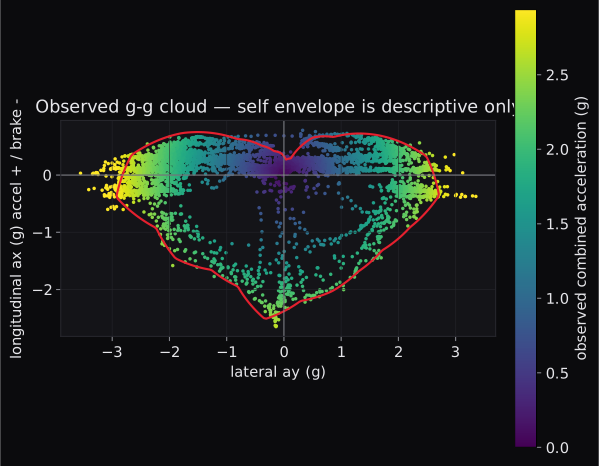
One picture belongs here before moving on. Plot every sample of a lap as a single point, sideways acceleration on one axis, braking and traction on the other, and the lap becomes a cloud. Its outer edge is the most the tires delivered in every direction that day; the dense rim is time spent at that limit; the hollow center is time spent merely traveling between corners. Notice that the cloud is round at its corners rather than cross shaped: a tire braking and cornering at the same time is sharing one reservoir of grip between the two jobs, not drawing from two separate ones. That single shape carries enough consequences for how a lap is driven that it gets a full post of its own.
The second variable: the tire's own condition
Load is the outside world acting on the tire. The tire also has an inside story, and the data tells it in two channels: temperature and pressure.
Rubber's mechanical character changes with temperature. Cold, a racing compound is stiff and reluctant to conform to the road's texture; brought up to its working range it softens and grips; pushed far beyond that range it degrades. A racing tire is therefore not merely sitting on the car, it is operating, and whether it is inside or outside its working window is part of what the car's grip is at any moment.
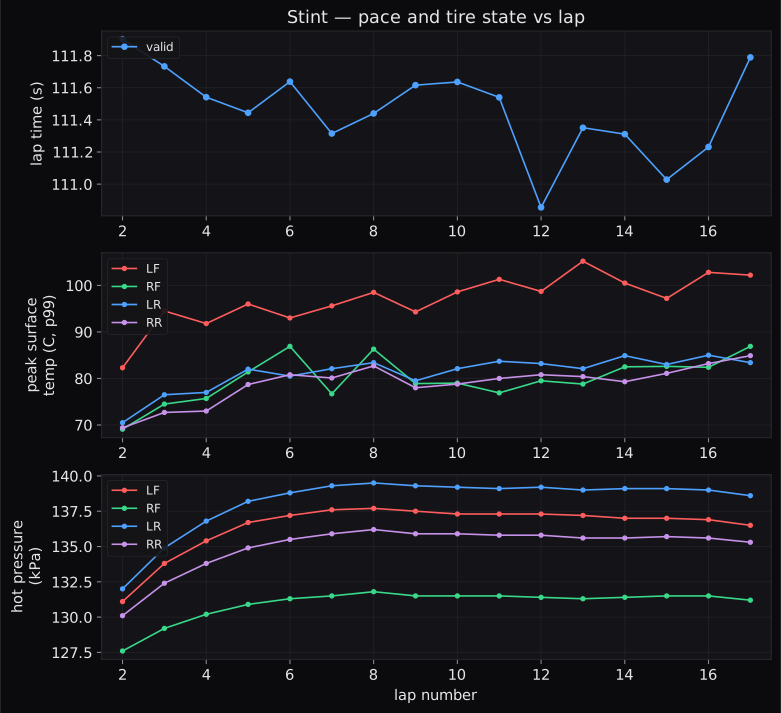
The sixteen lap Silverstone run shows a tire's thermal life with no instrumentation effort at all, because the sim streams three tread temperatures per tire continuously. The left front's peak surface temperature, lap by lap (MEASURED, abbreviated here; the full table covers all four tires):
| lap | left front peak C | lap time s |
|---|---|---|
| 2 | 82.3 | 111.901 |
| 5 | 96.0 | 111.444 |
| 8 | 98.5 | 111.440 |
| 11 | 101.3 | 111.540 |
| 14 | 100.5 | 111.311 |
| 17 | 102.2 | 111.789 |
Three lessons sit in this one stint.
The heat maps the work. The left front climbed from 82 C to over 100 and stayed the hottest tire on the car for the whole run, gaining a fitted 0.91 C per lap against 0.57 to 0.67 for the other three corners. The reason is geography: most of the named corners on this Silverstone layout load the car rightward, and a right hand corner works the left side tires. Read the four temperatures and the shape of the racetrack appears in them. Through Copse, taken here at an apex speed just under 220 km/h, the front tires peaked at 100.1 C while the rears saw 82.4; the tire data is, corner by corner, a record of which rubber did the work.
Pressure follows heat, then settles. Every tire in this run left the garage at 124.1 kPa cold. The gas inside warms with the tire and the running pressures climbed lap after lap until, around lap 8, they stopped: the left front held near 137 kPa and the left rear near 139 for the rest of the run, within about half a kPa. That plateau is a tire reaching thermal equilibrium, shedding heat as fast as the driving adds it. It is also the quiet lesson that the pressure that matters is the hot one. The cold figure is a setting chosen in the garage; the hot figure is a behavior the run produces; and the craft is choosing the first to land the second where the tire works best. In a simulator this old craft becomes an exactly scored exercise, because every lap's full pressure history is on file.
The data refuses a tidy ending, and that is a lesson too. Lap times across this run actually fell slightly, a fitted 0.028 s per lap, while the tires got twenty degrees hotter. Was the heat helping? Not necessarily: over those same sixteen laps the car burned 24 kg of fuel and got lighter, and the track surface itself was gaining rubber. Three mechanisms moved together and this session, by itself, cannot split the credit among them. An honest read stops exactly there. Separating entangled causes takes controlled experiments, fixed fuel, back to back runs, and designing those experiments is precisely where this series is headed.
One footnote for completeness, because it will matter in later posts: the sim also reports tread wear per tire, but in this car the wear channels only refresh as end of run snapshots rather than live, so any future case about tire life will have to rest on the live signals, temperatures, pressures, and the grip the tires still deliver late in a run.
Why a simulator is a real laboratory
Everything above was read from data no physical junior team could afford to collect. Three live tread temperatures per tire, individual wheel speeds, per corner shock motion and brake line pressures, the car's full acceleration state, all at 60 samples per second: on lap 12 alone that is 6,651 samples of 144 channels, and 64 of those channels, sixteen per corner, describe the tires and the corners of the car they live at. Nearly half of everything a modern simulator says about a race car, it says about the tires. The technology agrees with the physics about what matters.
Just as instructive is what the stream leaves out. There is no channel for tire force; the accelerations report what the whole car achieved, never how the four tires divided the work. There is no downforce channel, as the load section already confessed. The tire model itself, the full internal law by which the simulated rubber trades load, angle, temperature, and pressure for force, is proprietary and unpublished. Even certain basic constants of the car are withheld; the steering ratio, which converts hand motion at the wheel into actual tire angle at the road, appears nowhere in the stream for this car.
That combination, rich measurement around a hidden law, is exactly the situation of a real race engineer, whose tire supplier guards its data just as closely. It is what makes a simulator more than a game for this kind of work: it is a laboratory with a locked cabinet in the middle. The cabinet can be attacked, because the laboratory has properties no real test day offers. Experiments are free. Conditions repeat perfectly on demand. Nothing wears out except by design. A hidden constant can be recovered by designing a test, running it, and checking the answer along an independent second route, and when this project did precisely that for the missing steering ratio, two separate measurement routes agreed within 2.2 percent, and the resulting constant (15.65 degrees of steering wheel per degree of road wheel, valid for this exact car and simulator build) entered the toolbox as a MODELED value with its provenance attached. Numbers that cannot yet be earned that honestly, the tire force curves, the downforce split, the classical handling metrics, stay explicitly withheld until their experiments have been run. There will be no pretending in this series that a number exists before it has been earned.
What an introduction owes its reader
A summary, in the order the evidence taught it:
Grip is a force between tire and road, the only force that ever turns, slows, or accelerates a car, and it is visible in recorded acceleration data at 60 samples per second. It is not a fixed property but a variable. Its first master is vertical load, which is why wings exist and why one car can brake at 1.10 g slow and 2.29 g fast; and load's help comes at a bending rate, which is why the distribution of load across the four tires, the true subject of car setup, matters as much as its total. Its second master is the tire's own condition, temperature and pressure, which the data shows climbing, settling into a working state, and mapping exactly which rubber does the work at which corner of which track. And all of it was read, verifiably, from a simulator that streams half its channels about the tires while keeping the deepest law, the tire model itself, locked away.
That locked cabinet sets the agenda. Every hidden number in it can be cornered with a designed experiment, run for free, in perfectly repeatable conditions, and checked along independent routes before it is believed. The next post opens the toolbox on the first of those experiments: recovering a constant the simulator refuses to publish, what nearly went wrong, and what the recovered number unlocks.
Sources: telemetry session f78654b67c69e481 (Silverstone Circuit, Arena Grand Prix, Super Formula Lights 324, 2026-07-09, sixteen laps at 60 Hz), analyzed with this project's engine; accelerations are the simulator's gravity corrected body frame channels at the stated percentiles, not independent force measurements. Lap 12 of the session: interactive traces on Garage61 · full 144 channel record (gzipped JSON, 3.3 MB compressed, 14.9 MB unpacked).